Corona Trends
There is a lack of graphs focusing on cities in the Covid pandemic, especially in showing their current and trending situation. So, past research, on identifying key cities for creating global indices, was used to include a selection of 7 cities per region based upon Loughborough University’s City Link Classification (connectivity), nation diversity, as well as city, national and regional contributions to Global Domestic Product (GDP).
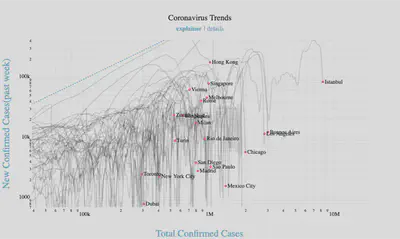
Modified version of the graph created by Aatish Bhatia in collaboration with Minute Physics. This graph was chosen as it effectively represents exponential growth trends, which is perhaps the most challenging aspect of pandemics. The short explainer video is a clip from Minute Physics explainer video.